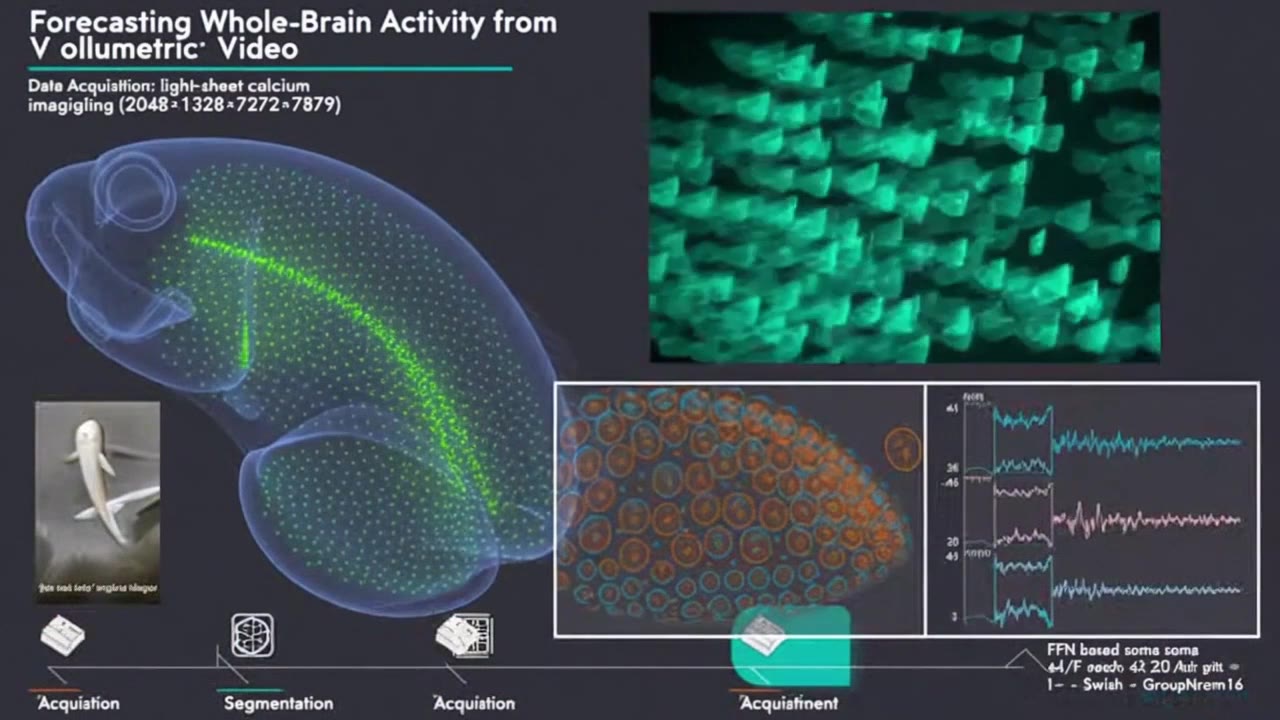
End-to-end pipeline
Data acquisition via light-sheet calcium imaging, followed by segmentation and ΔF/F trace extraction — the full ZAPBench workflow at a glance.
A field-wide review of whole-brain neuronal activity prediction and synapse-resolution connectomics — from Caenorhabditis elegans through larval zebrafish to a cubic millimetre of human temporal cortex. Eight papers. Six species. One question: can a machine learn to anticipate what a brain will do next?
Modern connectomics and activity-prediction work unfolds across a ladder of model organisms — each chosen because it trades complexity for tractability. The pattern is clear: as imaging and machine learning scale, the brains we can map grow larger.
The Zebrafish Activity Prediction Benchmark is the first dataset that pairs whole-brain activity recordings with the structural connectome of the very same animal — a vertebrate, at single-cell resolution.
Six-day-old larval zebrafish are almost perfectly transparent and small enough that a specialised laser-scanning microscope can image the entire brain slice-by-slice in 3D. The fish used in ZAPBench was genetically modified to express GCaMP — a fluorescent calcium indicator that lights up when calcium ions enter active neurons.
While immobilised in a jelly-like medium, the fish was shown nine different computer-generated stimuli modelling the conditions it would meet in shallow rivers: shifting water currents, alternating light and darkness, powerful sweeps that would normally carry it away. Electrodes on the tail recorded "fictive" swimming — motor intent without movement.
Two hours of whole-brain activity were captured. Collaborators Alex Chen and Misha Ahrens at HHMI Janelia performed the recording; the Engert and Lichtman labs at Harvard contribute the synapse-resolution EM reconstruction that is still underway on the same specimen.
The raw recording is a four-dimensional volumetric video — 2048 × 1328 × 72 voxels per frame, 7,879 frames in total, XY resolution 406 nm. Motion artefacts were first removed with phase cross-correlation for translational alignment, followed by two rounds of elastic alignment using Google's open-source SOFIMA library to correct non-rigid deformations.
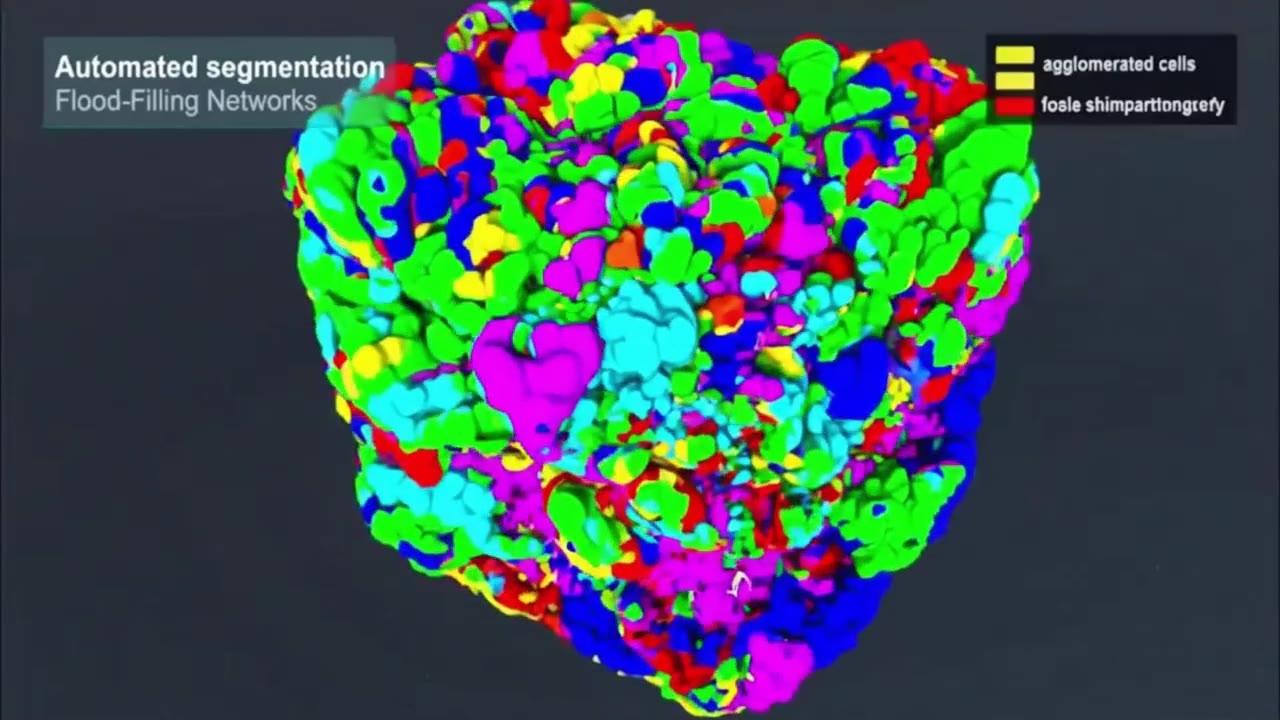
A customised Flood-Filling Network, trained on manually annotated ground-truth from VAST, then segmented the neuronal somas. The segmentation was downsampled 4× to match the activity-data resolution; averaging the intensity of voxels inside each mask yielded an activity trace — a 1D time series — for every one of 71,721 neurons.
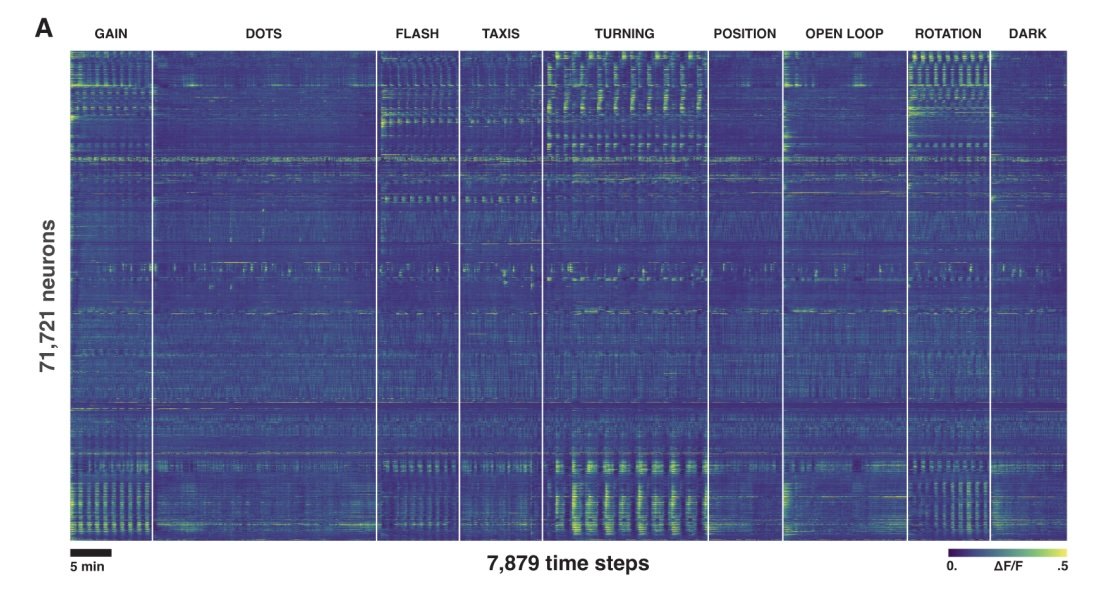
ZAPBench poses the prediction problem in the same form as weather or language: given a clip of recorded activity, how accurately can a model forecast the subsequent horizon? Two data regimes are evaluated — time-series models that consume the 1D traces, and volumetric-video models that operate directly on the 3D+time voxel data.
The short-context setting uses C = 4 past frames; long-context uses C = 256. All predictions are evaluated against ground truth over a horizon of H = 32 frames using mean absolute error, plus Corr_H and Corr_W correlation metrics at both whole-trace and horizon granularity.
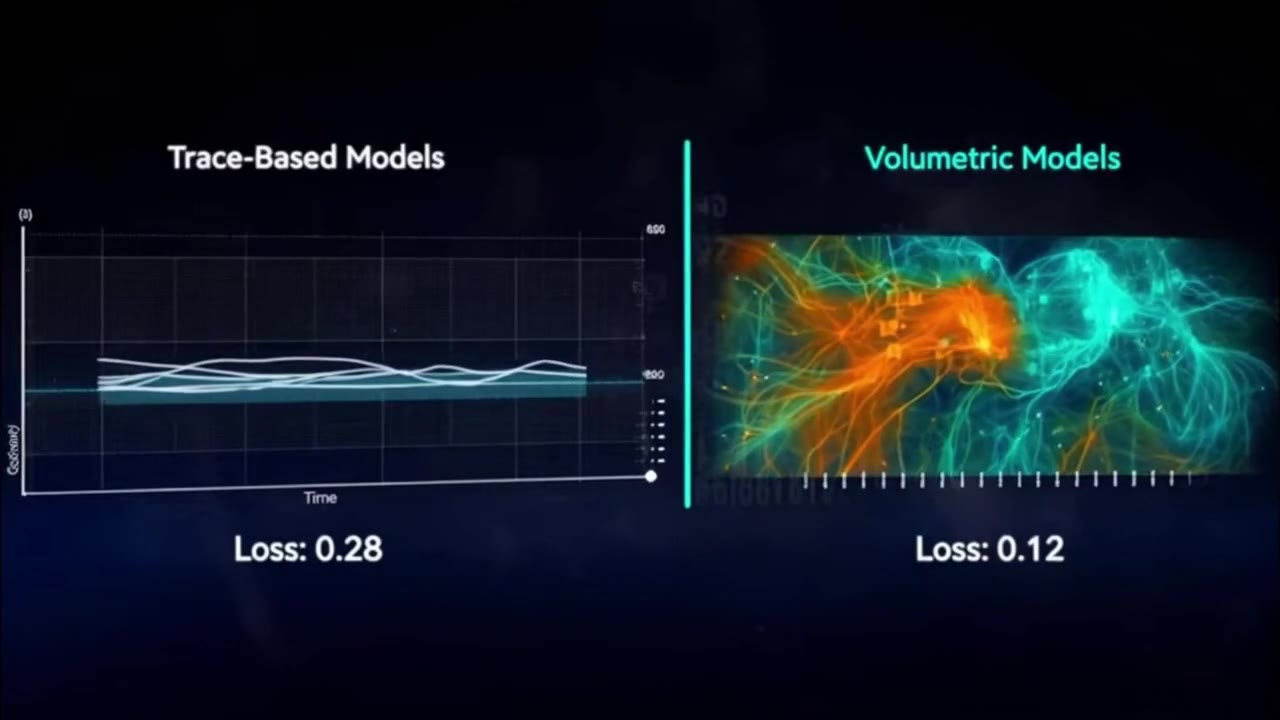
Initial baselines include univariate time-series predictors (TSMixer, TiDE) and a 4D U-Net that treats time as extra channels and learns directly from volumetric video. Strikingly, trace-based multivariate models that could in principle learn functional coupling between cells do not significantly outperform univariate ones — but the volumetric U-Net does, by exploiting spatial context that never exists in a 1D trace.
Three results emerged from the baseline models. First, more context helps — significantly. Second, volumetric-video models outperform trace-based models in many conditions, thanks to spatial information that is simply absent from 1D traces. Third, when models fail, they fail in geographically concentrated regions of the brain — meaning some territories are intrinsically harder to forecast than others.
Video models also work well at lower resolution, hinting that much of the signal lives at spatial scales coarser than single cells. Google is now completing a whole-brain connectome for the same specimen at HHMI Janelia — the first time a vertebrate activity recording will be paired with a full structural reconstruction of the same brain.
The piece of tissue was the size of half a grain of rice. Encoding it required 1.4 petabytes — fourteen hundred terabytes — of storage. Inside: 57,000 cells, 230 millimetres of blood vessels, and roughly 150 million synapses.
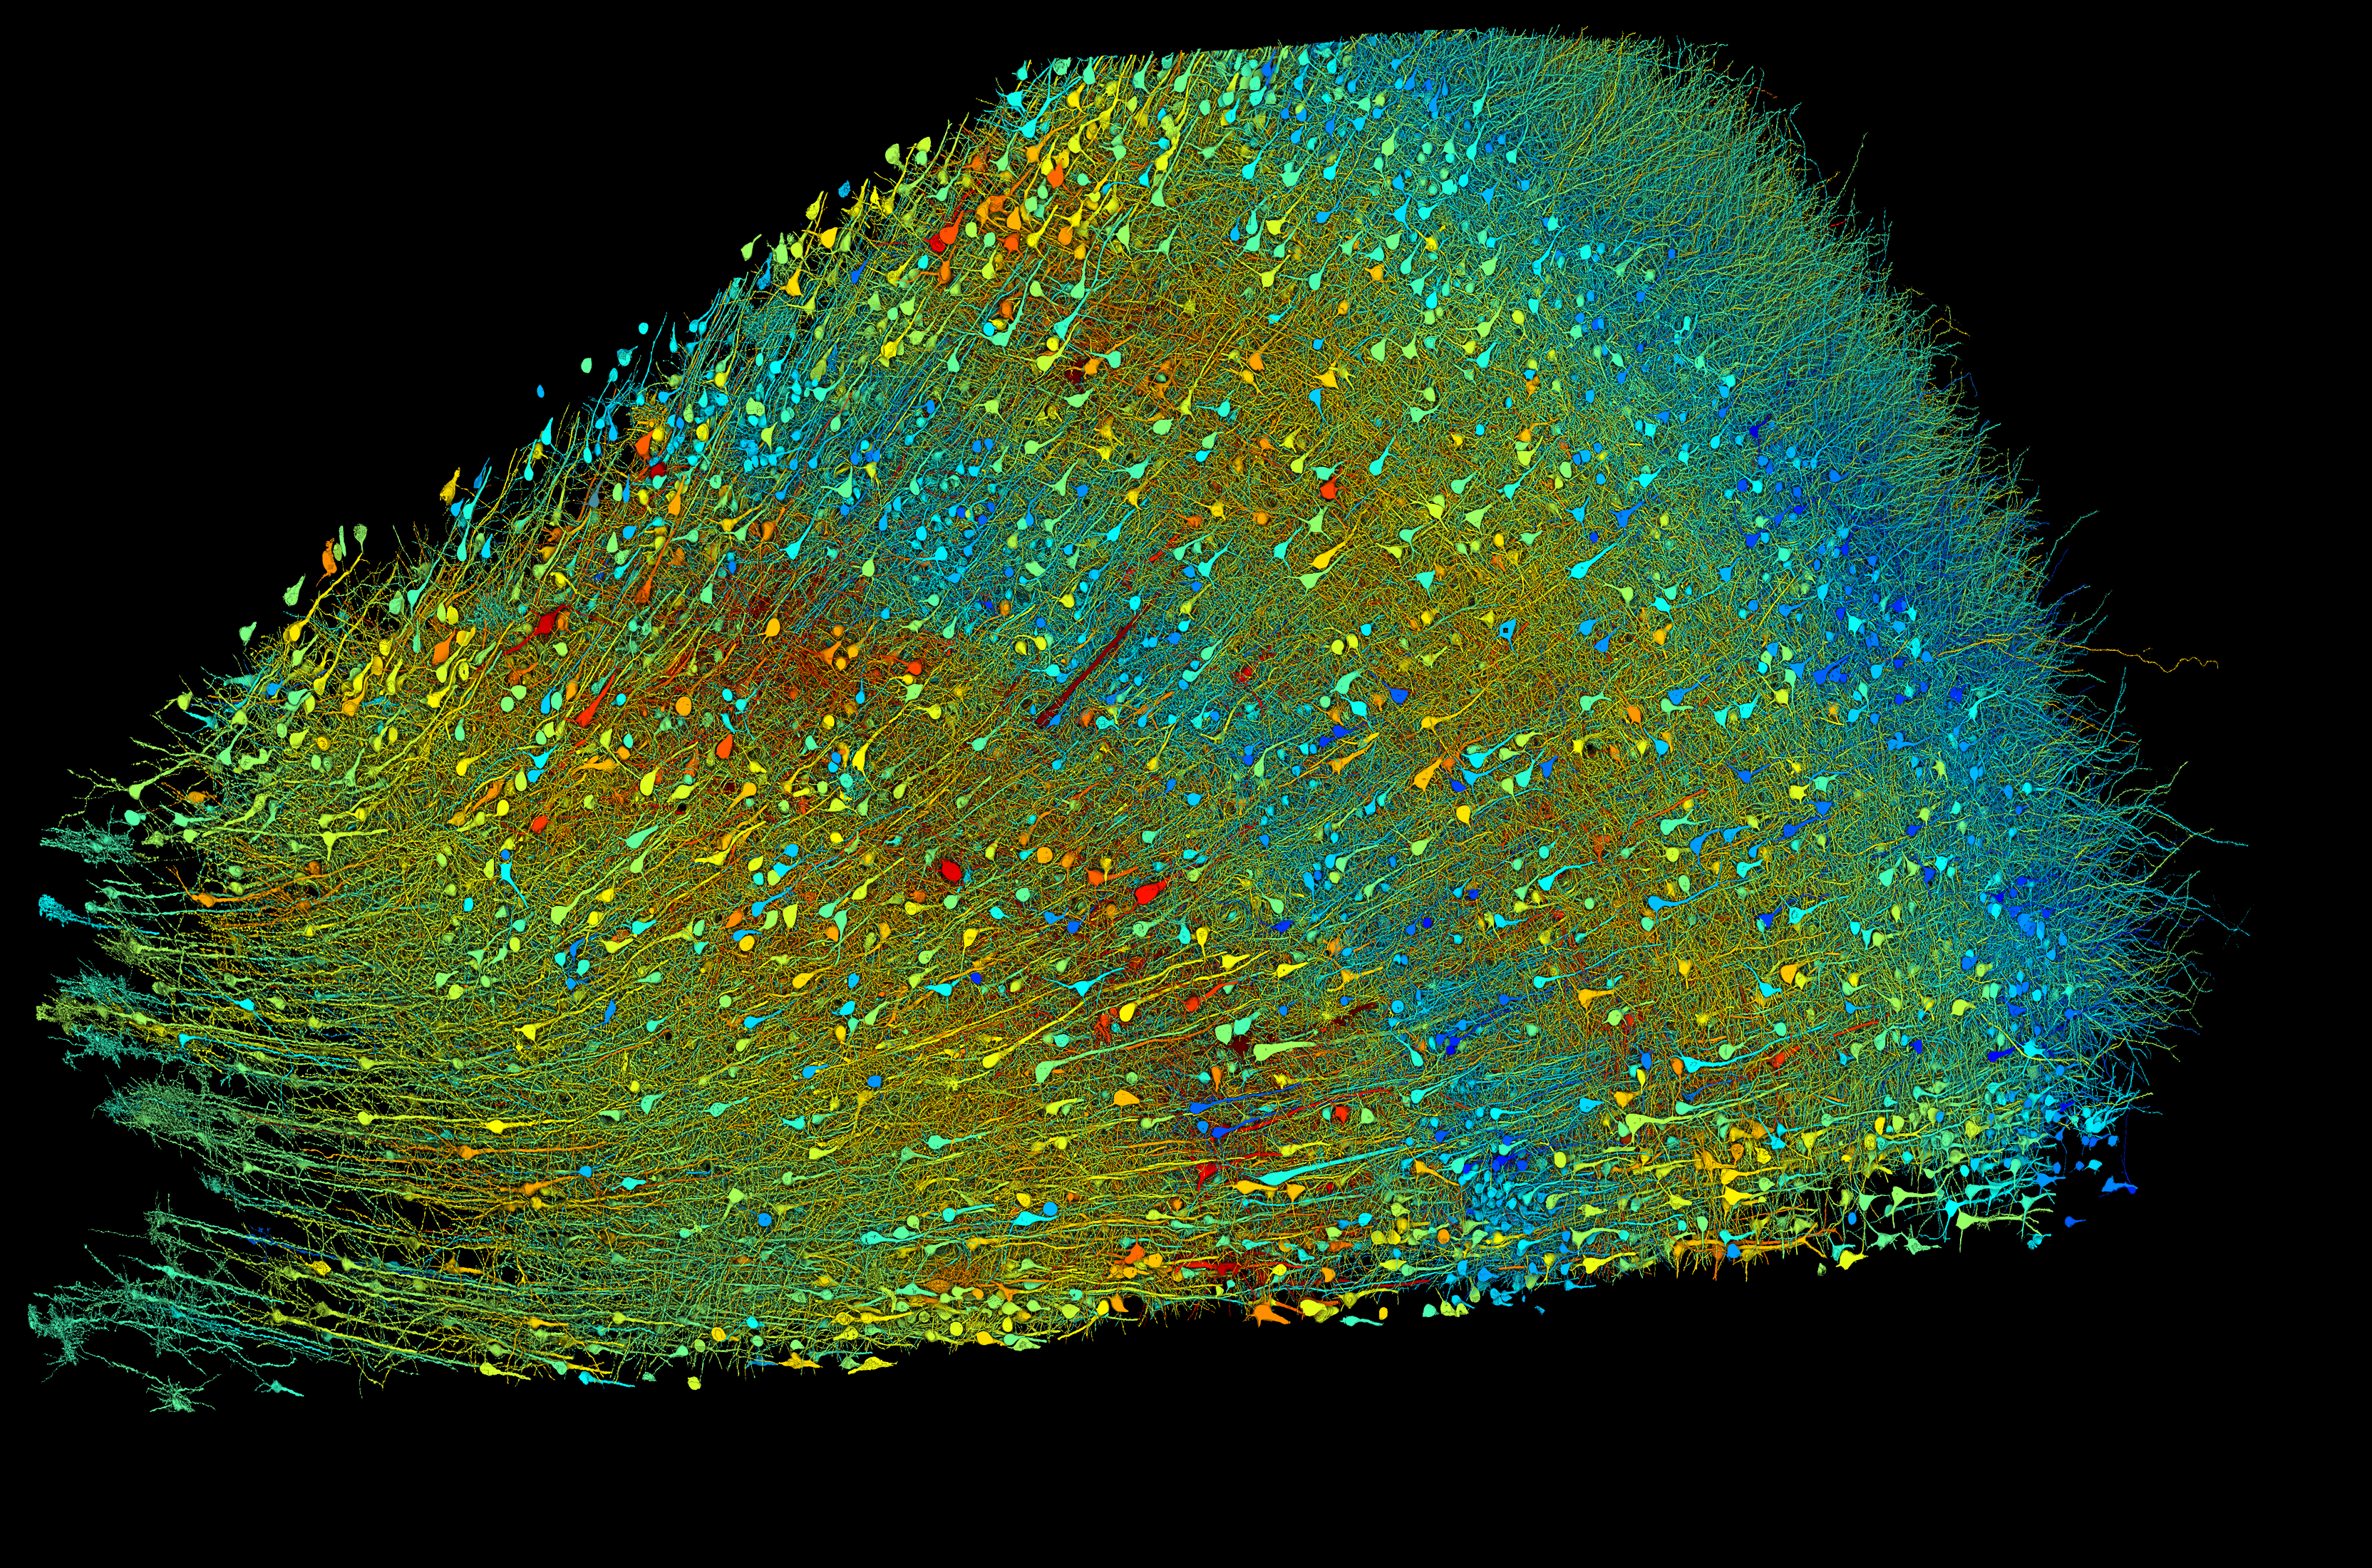
The sample was taken from a patient undergoing surgery to access an underlying epileptic focus. Rapid preservation, heavy-metal staining, and resin embedding followed. Jeff Lichtman's laboratory at Harvard then cut more than five thousand sections at approximately thirty nanometres each and imaged them using the ATUM-mSEM method — a Zeiss multibeam scanning electron microscope that uses 61 simultaneous electron beams to cover a hexagonal area of roughly 10,000 µm² at a time.
Pixels were 4 × 4 nm². Each single section, about 4.5 mm² in area, generated over 300 gigabytes of image data. The acquisition phase alone took 326 days of continuous imaging.
The raw electron-microscopy stack was aligned with optical-flow-based SOFIMA, segmented using Flood-Filling Networks, agglomerated into whole-cell reconstructions, and proofread through a custom CAVE (Connectome Annotation and Versioning Engine) platform integrated with the Neuroglancer web viewer. A separate subcompartment classifier flagged merge errors where axons and dendrites had been incorrectly joined and suggested cut points to correct them.
Released in a nine-paper package in Nature on 2 October 2024, the FlyWire connectome is the full neuronal wiring diagram of a single adult female Drosophila melanogaster. 139,255 neurons. 54.5 million chemical synapses. Eight thousand, four hundred and fifty-three cell types.
The raw data came from the Bock lab at HHMI Janelia, who in 2018 imaged an entire adult female fly brain by electron microscopy — 21 million images spanning 7,050 ultrathin slices. Google Research's Flood-Filling Networks performed the initial automatic segmentation. Then the FlyWire Consortium — more than 200 people across 50 labs, including trained citizen-scientist proofreaders — took four years to verify every neuron and every connection.
Mala Murthy and Sebastian Seung of Princeton led the consortium; the Jefferis lab at Cambridge MRC-LMB, the Bock lab at University of Vermont, and teams at Allen Institute for Brain Science contributed critical infrastructure. The Funke lab at Janelia supplied synapse predictions and neurotransmitter classifications; the Eckstein et al. (Cell 2024) classifier discriminates acetylcholine, GABA, glutamate, dopamine, octopamine, and serotonin at synapse-level resolution.
FlyWire estimates that without AI segmentation, completing this connectome would have required roughly fifty thousand person-years of manual tracing. With AI, it took 33 person-years of proofreading.
Two companion Nature papers in April 2025 delivered the largest functionally imaged electron-microscopy dataset ever assembled — and the foundation model that learned to predict neural responses across it.
MICrONS co-registered two datasets acquired from the same mouse: dense two-photon calcium imaging of about 75,000 excitatory neurons in primary visual cortex (VISp) and higher visual areas (VISrl, VISal, VISlm), and a serial-section transmission electron-microscopy reconstruction of the same tissue. The imaged volume measured 1.3 × 0.87 × 0.82 mm³ in vivo.
Wang et al. (Nature 640:470–477, 2025) trained a deep recurrent network — a convolutional-LSTM core — on natural-video responses from eight mice. The resulting "foundation core" predicted neuronal responses across mice, across cortical areas, and across stimulus domains that were never seen during training: coherent random moving dots, dynamic Gabor patches, flashing dots, directional pink noise, static natural images.
Ding et al. (Nature 2025, 10.1038/s41586-025-08840-3), also drawing on MICrONS, showed that neurons with similar functional response properties are preferentially connected — not just within V1, but across cortical layers and between visual areas, including feedback projections. The same "like-to-like" connectivity pattern emerges independently in artificial neural networks trained on visual tasks, where it proves essential to performance.
A wiring diagram is a description. A model is a prediction. Three recent papers turn static connectomes into simulations that can be interrogated, probed, and compared against physiology.
Philip Shiu and collaborators (Nature, 634:210–219, October 2024) built a leaky-integrate-and-fire model of the entire adult Drosophila central brain directly from the FlyWire connectome — more than 125,000 neurons and ~50 million synaptic connections, signed by the neurotransmitter classifier of Eckstein et al. The model requires no deep-learning training; every parameter is either a measured connection weight or a physiological constant.
When the model's sugar-sensing gustatory neurons are stimulated, the simulated cascade activates motor neurons that extend the proboscis — the same behaviour real flies show. When bitter is mixed with sweet, inhibitory neurons intervene and stop the cascade, protecting the virtual fly from poison. Mechanosensory activation drives simulated antennal-grooming circuits. Reported motor-behaviour prediction accuracy: ~95%.
Janne Lappalainen and Srinivas Turaga's group (Nature 634:1132–1140, September 2024) asked a harder question: can connectivity alone — without recordings from the neurons themselves — predict their activity? They built a differentiable model of 64 cell types in the Drosophila optic lobe, with architecture fixed by measured connectivity but free parameters governing single-neuron and synaptic dynamics.
They then trained these free parameters on a computer-vision task — optic-flow estimation from dynamic visual stimuli. The trained network correctly predicted, neuron-by-neuron, the experimentally measured separation of the visual system into light-increment (ON) and light-decrement (OFF) pathways, and the direction selectivity of the well-characterised T4 and T5 motion-detector neurons.
The model was released as flyvis — an open-source PyTorch implementation that has become a template for connectome-constrained task-trained networks.
Before connectomes existed for larger animals, OpenWorm set out to simulate the entire Caenorhabditis elegans — all 302 neurons, all 95 body-wall muscle cells, all 959 somatic cells, down to ion-channel dynamics. The project has run since 2011 as an open, distributed collaboration; Sarma et al. (Phil. Trans. R. Soc. B 373:20170382, 2018) describes its architecture.
OpenWorm couples two simulators through the web-based Geppetto platform: c302, a multi-compartmental neural-network simulator operating on the NeuroML-encoded connectome, and Sibernetic, a soft-body fluid-dynamics simulator that models the worm's body and its environment using Smoothed Particle Hydrodynamics.
While OpenWorm remains less complete than its successors — BAAIWorm (Zhao et al., Nat. Comput. Sci. 2024) now simulates 136 of the 302 neurons with biophysically detailed models in a closed-loop 3D body — it set the methodological pattern every later effort has followed: integrate data at multiple scales, publish open tools, treat the organism holistically.
Until 2025, every dense synapse-resolution reconstruction in history had been made with an electron microscope — instruments that cost millions and live in a handful of well-funded labs. LICONN broke that monopoly.
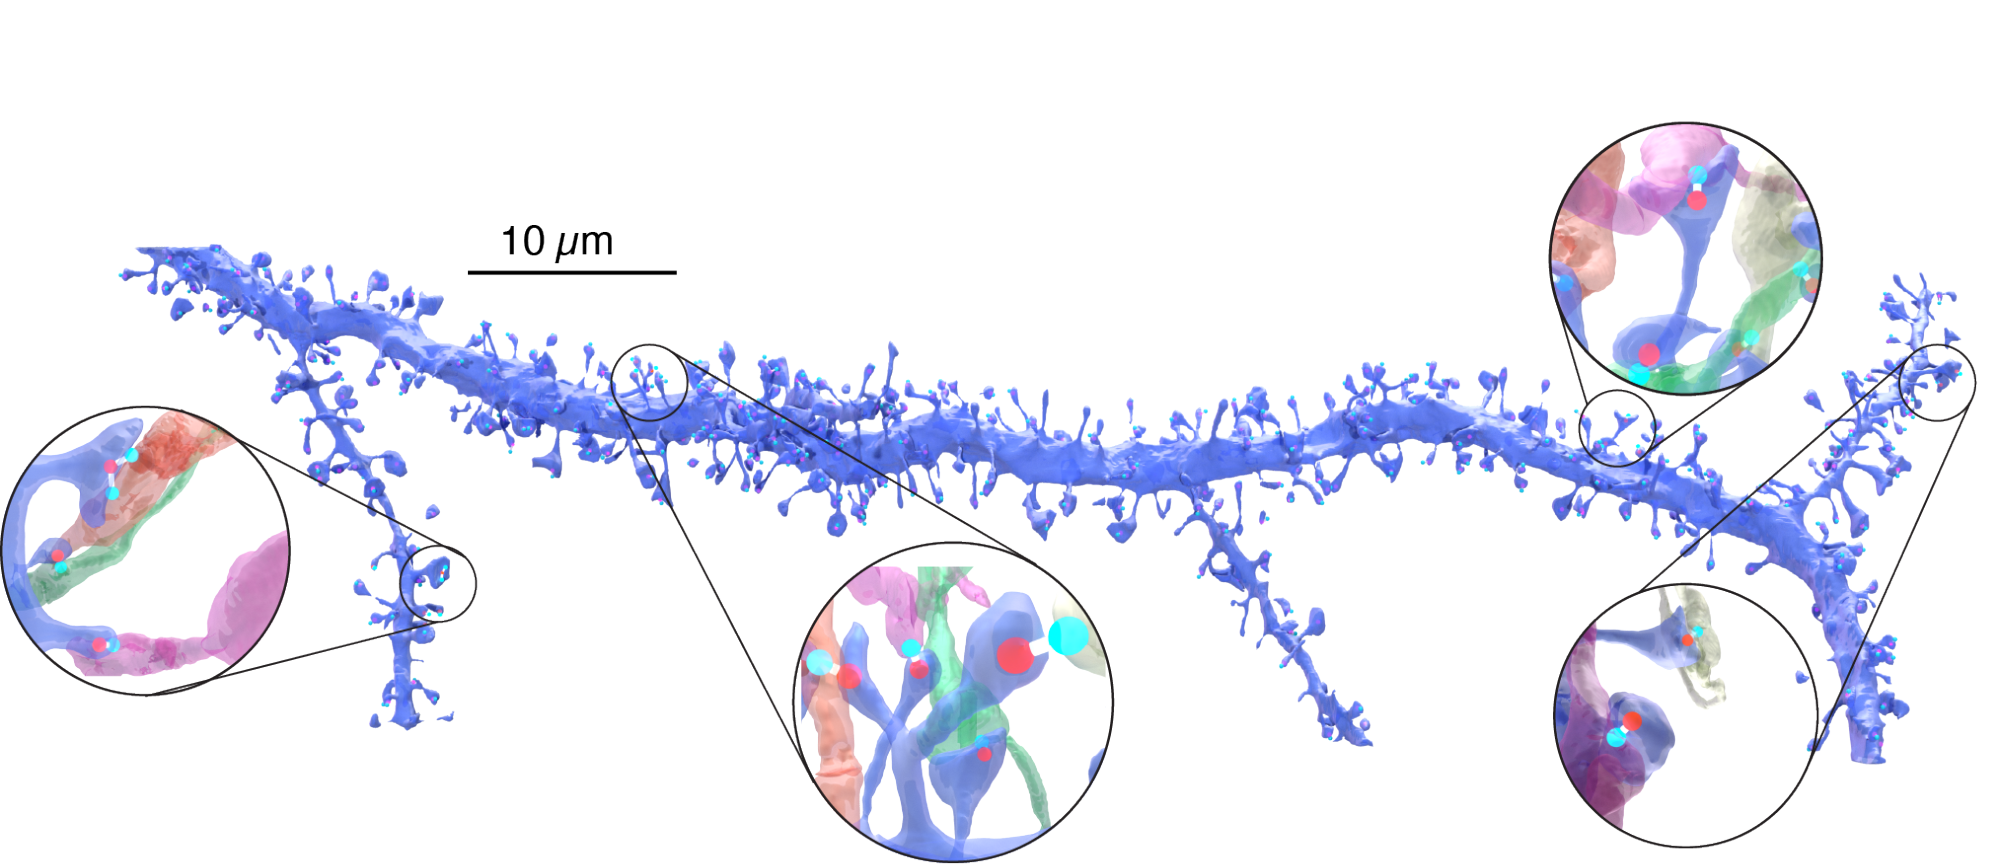
The Danzl group at the Institute of Science and Technology Austria (ISTA), working with Michał Januszewski and Viren Jain of Google Research, took a different route to nanoscale imaging. Rather than pushing optics beyond the diffraction limit, they physically enlarged the tissue itself — using iterative hydrogel expansion — until features normally hidden below 250 nm resolved clearly under a standard confocal microscope.
Tissue sections of 50 µm were sequentially embedded in three engineered hydrogels. The first two form distinct interpenetrating polymer networks that each expand by a factor of four; a third stabilises the composite. The cumulative expansion factor is approximately 16× in every direction, anchoring cellular proteins into the gel so that native ultrastructure is preserved as it scales up.
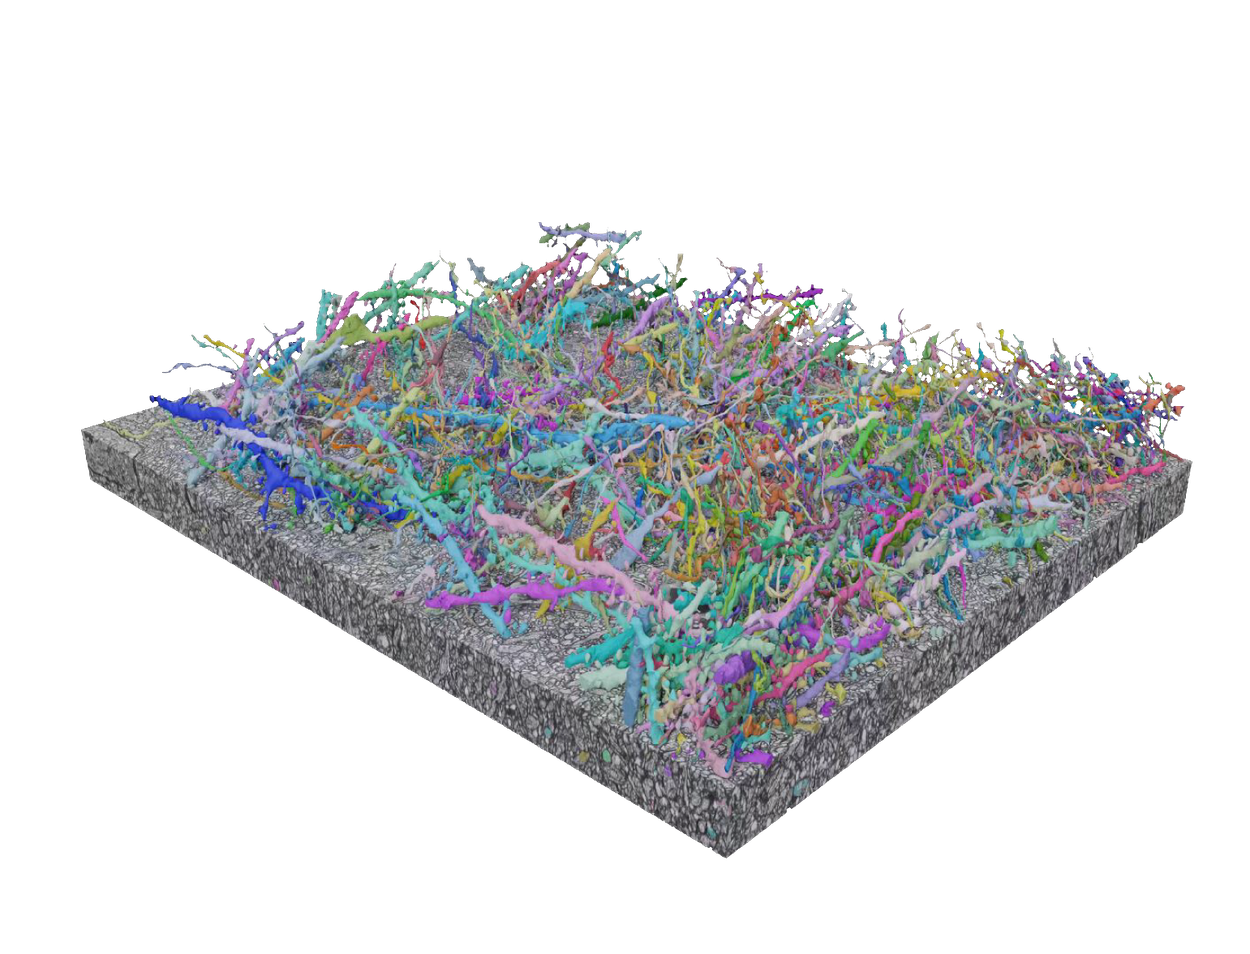
The team reconstructed a volume of approximately 1 × 10⁶ µm³ of mouse primary somatosensory cortex (layers II/III – IV) — about 0.95 × 10⁶ µm³ at native tissue scale, roughly 3.5 × 10⁹ µm³ after 16× expansion. They then applied Google's Flood-Filling Network segmentation and SOFIMA alignment — the same tools that underpin FlyWire and H01 — to the expanded, fluorescence-imaged stacks.
In a smaller hippocampal volume, independent annotators manually traced approximately 0.5 metres of neurites from the structural channel only; comparison to ground truth from a sparsely labelled Thy1-eGFP mouse confirmed that the light-microscopy reconstruction recovered the finest axons and dendritic spines with accuracy comparable to EM-based connectomics.
A handful of open-source projects — many developed by Google's Connectomics team — underlie almost every reconstruction and every forecast in this review. They are the infrastructure of a field.
Each entry represents a leap in either the size of the brain mapped or the fidelity of the model built on top of it.
Every figure, statistic, and claim in the preceding sections traces back to one of these peer-reviewed publications. DOIs and direct links are provided for verification.
The exact hyperparameters used for the ZAPBench baseline models. Details from the ICLR 2025 paper's appendix; the volumetric U-Net (Immer et al., S4) is the reference multivariate model.
Each of these short animations explains one step of the ZAPBench workflow. Click to play. Inline versions also appear in the relevant sections above.
Core terms from connectomics, computational neuroscience, and deep learning for volumetric neural data.